
Blog
Aug 17, 2020
Asset Reliability & Maintenance in the Oil and Gas Industry Part 3: What Model Is Right for You?


In parts one and two of this series, we reviewed the benefits of optimizing operations through data. Saving time and money, improving safety, and creating competitive advantages can be realized by optimizing asset reliability and maintenance. We also stepped briefly through the hierarchy of asset reliability and maintenance models and focused on the models that would help companies reach optimal operations by leveraging data appropriately.
This blog will explain the complexities of each optimized model and outline how to determine which models are right for you. The next blog in this series will focus on how artificial intelligence (AI) and machine learning (ML) can be used to improve the reliability and maintenance process as well as what it would look like to leverage Credera as a resource to implement them.
Condition-Based Maintenance
As we discussed in part two, condition-based maintenance relies on “condition checks” of the equipment to help determine maintenance scheduling. Companies often resort to sensors, transducers, and other portable instruments to measure various aspects of the equipment, identify deviations, diagnose problems, and plan accordingly. Vibrations and temperature are common conditions to measure, and there are many analysis techniques depending on the asset that is being monitored. We will cover a few in detail below.
Monitoring/Analysis Techniques
Vibration analysis is a common method used on rotating equipment to measure the changes in vibration patterns affected by wear and tear, misalignments, imbalances, and design flaws. There are a few different ways to monitor vibrations, one of which is shock pulse monitoring technology, which converts the shocks from bearings to electric pulses. The pulses are processed and evaluated to output an overall evaluation of the asset in a green-yellow-red system. Since each issue is unique, the evaluation also produces key variables that will help determine a diagnosis.
Lubricant analysis is the testing and evaluation of the number and condition of contaminants found in the machine oils. When equipment or machinery begins to age, it can deposit contaminants in the lubricating oils, which would be a sign that the equipment is close to failure or needs repairing. Some examples of signs of failure or needed maintenance are presence of water, viscosity tests, microbial analysis, iron content, and sediment tests.
Ultrasonic monitoring uses high frequency sound waves to detect even the smallest of changes in friction forces that may be missed by other analyses. This analysis method is ideal when noisy and hot environments may mask certain issues.
Choosing the Right Monitoring/Analysis Technique
There are other types of monitoring/analysis techniques not mentioned here, and many companies use a combination to meet their specific needs. In order to determine which technique is right for a specific set of assets, the Failure Modes and Effects Criticality Analysis is a great method to use. It starts by first identifying the failure mode(s) for each asset, which simply means understanding and documenting the ways in which it could fail. The method will then help you identify the causes, frequency, and impact of those failures. A better understanding of the assets’ needs is crucial prior to determining the best monitoring/analysis techniques.
Vitality of Proper Data Processes
Once monitoring techniques are put in place, the system will transmit a warning to signal to the technician when there is a problem. Since the timing of failure and the event that caused the failure is unknown, the only indication is the warning signal from the monitoring systems. This data is crucial to the maintenance process, so it is vital that it be stored properly. There is a need for efficient processes for data gathering, analysis, and decision making in order to understand how to approach maintenance and repairs once the warning is given. We will walk through the ways in which a company can better prepare their data in part four of this series.
Predictive Maintenance
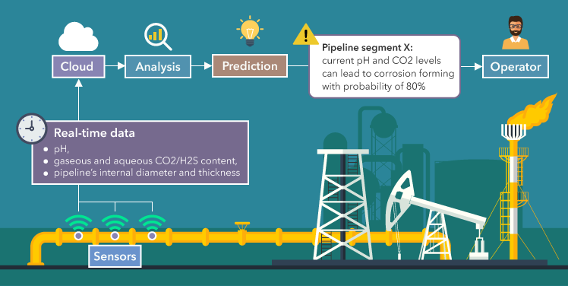

Predictive Maintenance Process Visualization, Source: ScienceSoft
AI and ML Predict Failures with Better Timing
Measuring the condition of an asset and responding to system warnings are helpful to avoid equipment failure. To even further analyze the results using AI and ML, experts can compare all the data points from the sensor over time. Leveraging this analysis on a continual basis allows companies to further anticipate failure and schedule maintenance at optimal times (perhaps during an already scheduled downtime) without having to wait for the warning light. This is called predictive analysis in industrial internet of things (IIOT), which oftentimes will lead to an earlier indication of failure and extend the time in which a piece of equipment can be repaired.
In order to implement predictive analytics, machine learning algorithms are needed. Some common examples include random forests, neural networks, or kernel methods. These algorithms take in all the historical sensor data and learn each time a new data point is added. It can then “predict” failure events based on the data and send warning signs before the sensors even register there is an issue. This is known as the remaining useful lifetime model (RUL) and is most successful with abundant and diagnostic historical data, so companies can look to implement this down the road once they’ve set up sensors. It is important to note this model does not predict the failure mode, only the timing, so a diagnosis is still needed.
Paired Data Eliminates the Need for Manual Diagnoses
Once the data is stored in a central location, you have the ability to circumvent a manual diagnosis for future issues by pairing the sensor data with the machine’s repair logs and applying predictive maintenance. This pairing of data commonly takes place in a data lake due to the quick and easy ingestion of unstructured and structured data. For more information regarding data lakes or other data repositories, please refer to this blog post by my colleague, Tyler Estes.
During the ingestion of data, new timestamps will be added, or existing ones will be standardized into the same format, commonly Coordinated Universal Time (UTC). These timestamps can then be used to join disparate data sources together and produce a better understanding of the diagnosis and the root cause of the problem as it relates to time. This combined dataset is now infinitely more impactful than the separate datasets, and it is in a state that can be more successfully leveraged for predictive maintenance. At Credera, our data scientists may even build a RUL regression model for each failure mode to predict even further in the future.
Real Companies Investing in Predictive Maintenance
GlobalData has identified leading oil and gas companies using predictive maintenance, like Royal Dutch Shell, ExxonMobil, and BP. These companies are not only investing in data to reap the rewards of predictive maintenance but also are beginning to move their data storage to the cloud. This shift will allow for real-time insights on asset condition and improved analytics on their data.
Risk-Based Maintenance
Portfolio Based Strategy
Risk-based maintenance is the most optimized way to approach asset reliability and maintenance and is more than just one model. It is a portfolio strategy that calls upon the most efficient maintenance model for each asset to “right size” a company’s assets. Once the asset’s criticality is determined, companies can allocate the increased effort and resources to more important assets. Ideally, this maintenance strategy gives companies the optimal maintenance plan with the minimum level of effort and cost required.
Measure Probability and Consequence of Failure for Each Asset
In order to determine an optimal strategy, companies need to measure their assets against two key metrics: probability of failure and consequence of failure.
Probability of failure can be identified by looking at the environment in which it resides (i.e. wet or dusty places), the age of the equipment, and the historical failures associated with the asset that may correlate to different failure rates. A common model used for displaying the lifetime of equipment is called the “bathtub” curve, overlaying the age-related failures with the constant, random failures to produce the observed failure rate. We can use the observed failure rate to predict how reliable the equipment should be using a reliability expression.
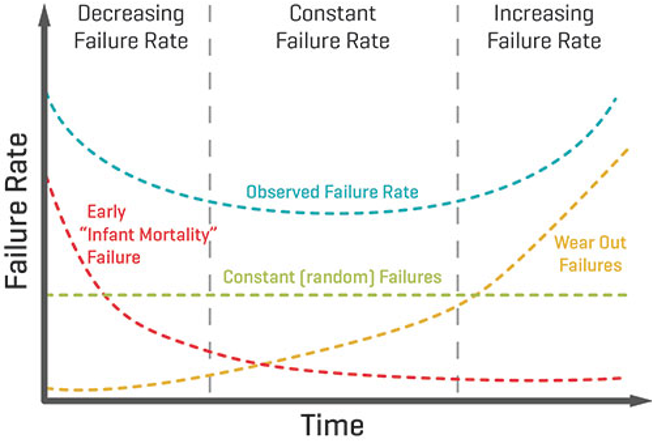
Bathtub Curve Model, Source: EET Asia
Next, determining the consequence of failure will look at the cost and risk associated with the failure of that piece of equipment. As an example, a piece of drilling equipment would have a higher consequence of failure, since it is a more crucial asset than an office printer.
The consequence of failure is determined by the effect that failure would have on safety, environment, production loss, and maintenance cost.
Some questions to consider related to these factors are:
What is the average repair cost?
How much productivity is lost due to repairs/failures?
Is there a safety concern if this asset were to fail? What safety hazards are associated with maintenance or lack of maintenance?
Are repairs negatively impacting other machinery?
Determine Criticality of Assets
Once the probability and consequence of failure have been determined for each asset, plotting all the assets on a criticality matrix will help companies visualize where to allocate their resources. The next step will be to determine the scale in order to plot the data on the matrix (see example below). For some companies, weighting the scores may be helpful too.
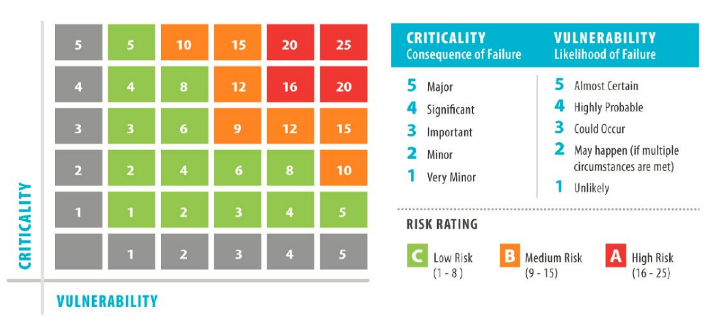
Example Criticality Matrix, Source: Prometheus Group
The criticality matrix will make it easier to call upon the various maintenance models to determine which one fits each asset. To save time and energy needed for data collection and investment, a sub-optimal maintenance model may even be better suited for non-critical assets. The benefit of risk-based maintenance is that each company will have a different portfolio strategy unique to their needs.
What Now?
Each of these models can offer benefits for many companies, but there is preparation needed for such an undertaking. Part four of this series will focus on the steps that companies should take in order to prepare their data, culture, and processes for these optimized models.
If you are interested in learning more about how Credera can help you optimize your asset reliability and maintenance processes, please contact findoutmore@credera.com.


Blog
May 26, 2020
Asset Reliability & Maintenance in the Oil and Gas Industry Part 1: Invest in Data
Leveraging data in the right way can unlock untold benefits for many companies, ranging from understanding customers’ needs...


Blog
Jun 22, 2020
Asset Reliability & Maintenance in the Oil and Gas Industry Part 2: Optimized...
Oil and gas companies can make better maintenance decisions by leveraging the right data and utilizing optimized models to...
Blog
Dec 1, 2016
Meet Credera’s Houston Leader, Kevin McDonald
We sat down with Credera’s newest partner, Kevin McDonald, to learn more about his journey to Credera and his plans for...

Contact Us
Let's talk!
We're ready to help turn your biggest challenges into your biggest advantages.
Searching for a new career?
View job openings