Data
May 09, 2018
Creating a Business Intelligence Publisher Report Using an Excel Template

As a technology consulting firm, we partner with our clients to design solutions that align with their immediate objectives and their future analytics roadmap. One of the key factors imperative to a solution’s long-term success is ensuring that the selected tool is cohesive and supported in the existing data platform environment. A recent client on an Oracle platform was looking to automate legacy Excel reports and were limited by customer demands in changing the report formats. Oracle Business Intelligence (BI) Publisher’s Excel template feature fit the bill perfectly.
BI Publisher is the report development tool for Oracle platforms. Similar to other established reporting platforms, BI Publisher offers web-based report development, data modeling capabilities, and various scheduling and distribution options. One unique offering is the ability to use an existing Excel document as a template for a BI Publisher report.
An Excel template is often helpful if legacy reporting formats are critical to maintain, if large quantities of data need to be viewed, or if calculations need to be made outside of the data model aggregations. This guide covers how to create a BI Publisher report using an Excel template.
Environments and Downloads
1. The Oracle Business Intelligence suite will be used to develop the data model, set bursting parameters, and schedule the report generation.
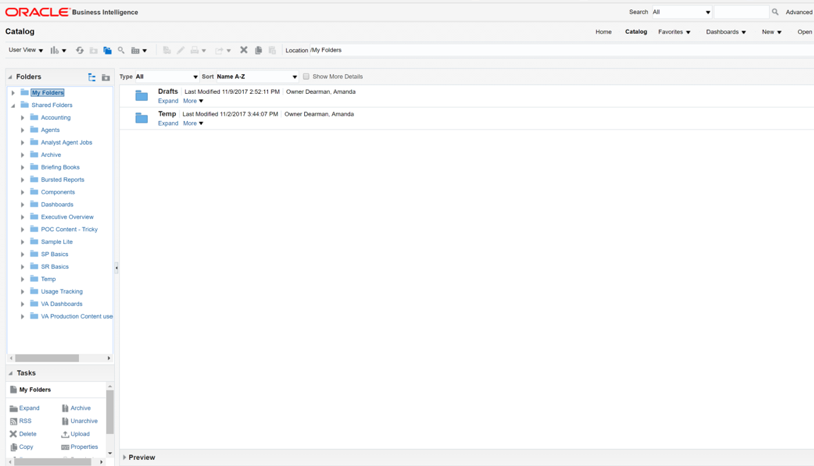
2. Download the Oracle BI Spreadsheet Excel Add-In. When successfully installed, a BI Publisher tab will be added at the top of your Excel workbook. You may have to enable the add-in using Excel options.

Building the Data Model
The data models are made up of data sets and represent the data that will populate your report. BI Publisher allows you to create data sets from multiple data sources. This data model introduction is intentionally brief. For more information and instruction on how to build a BI Publisher data model, please review Oracle’s user guide.
1. Create a new data model to open an edit window.

2. Add a data set. This report uses a SQL query data set.
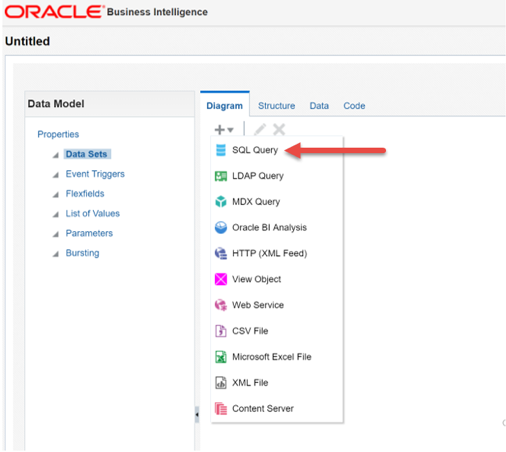
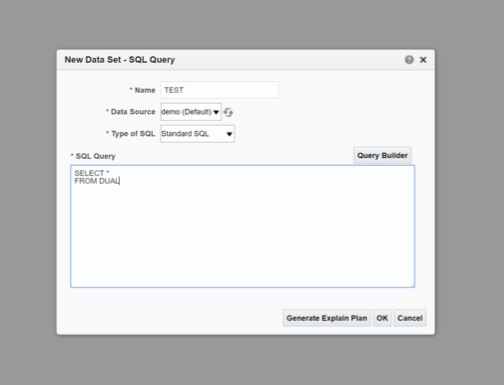
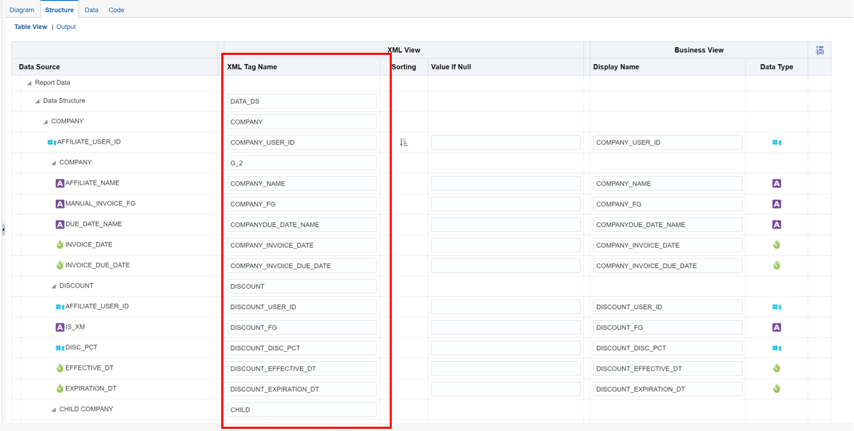
3. Update Tag Names in the data model structure tab. BI Publisher generates default names that are not required to be changed; however, intuitive names are helpful in the Excel template mappings.
4. Generate and save sample XML data. This data will be used when building the reports.
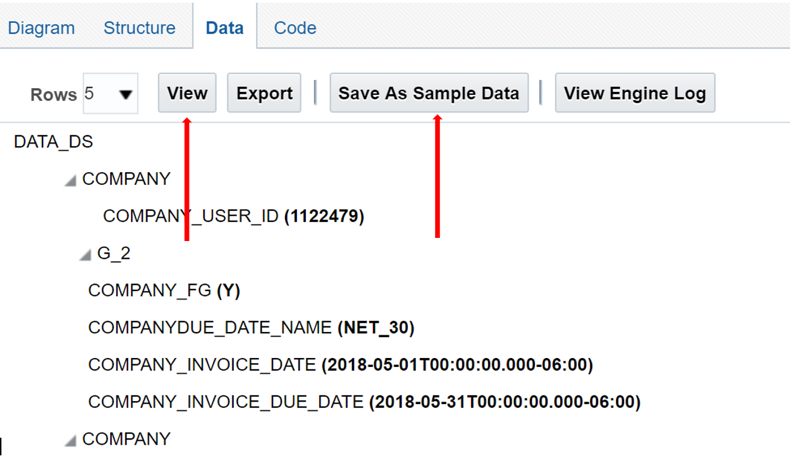
Data Model Tips and Tricks:
Name the data set intuitively, as this is will be what is shown when building your Excel templates.
If the data source you are looking for is not listed, it will need to be added to the BI Publisher environment as a global data source.
When naming the XML tags, prefixing the fields with the dataset name can be helpful when mapping in Excel. This is especially helpful if you duplicate data across data sets.
Save the data model frequently.
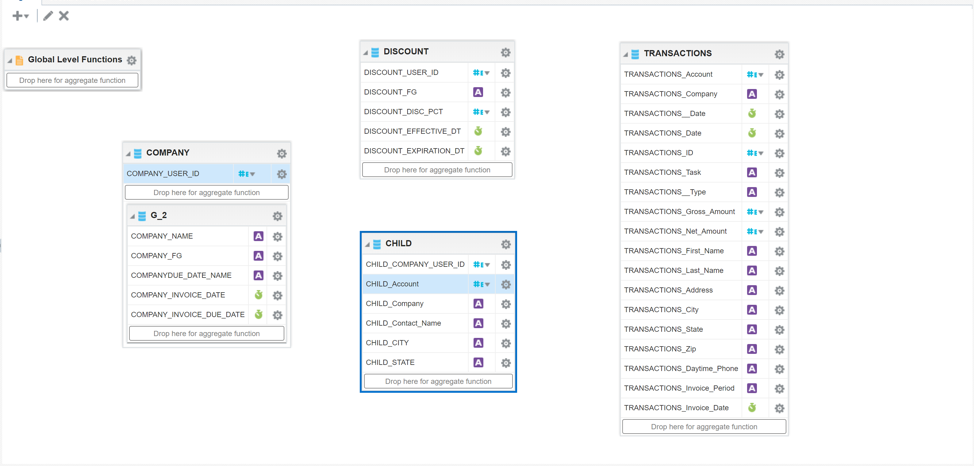
BI Publisher will allow you to build as simple or robust of a data model as you want. In most cases, I found it was easiest to build one dataset per Excel tab that I was planning. While this does duplicate some data across the data sets, it appeared to be a faster (report performance) and more efficient practice. Below are examples of two different ways to create data models
BI Publisher report bursting requires that you use the traditional BI data model and that you group the primary entity by the bursting key. Refer to the affiliate entity in the traditional BI data model below as an example of this grouping and find more information on BI Publisher Bursting here
Examples of Ways to Create Data Models
1. Traditional BI data model with keys and relationships:
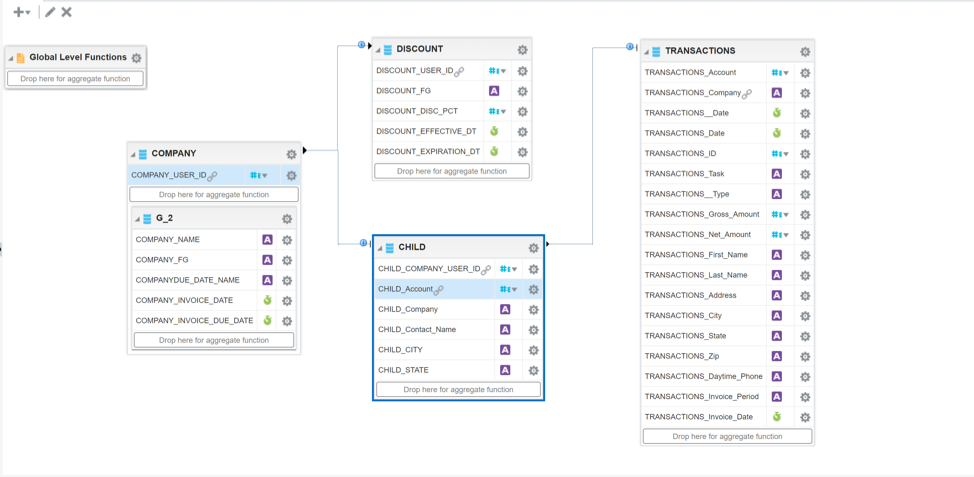
2. Data set per Excel tab:
Creating the Report
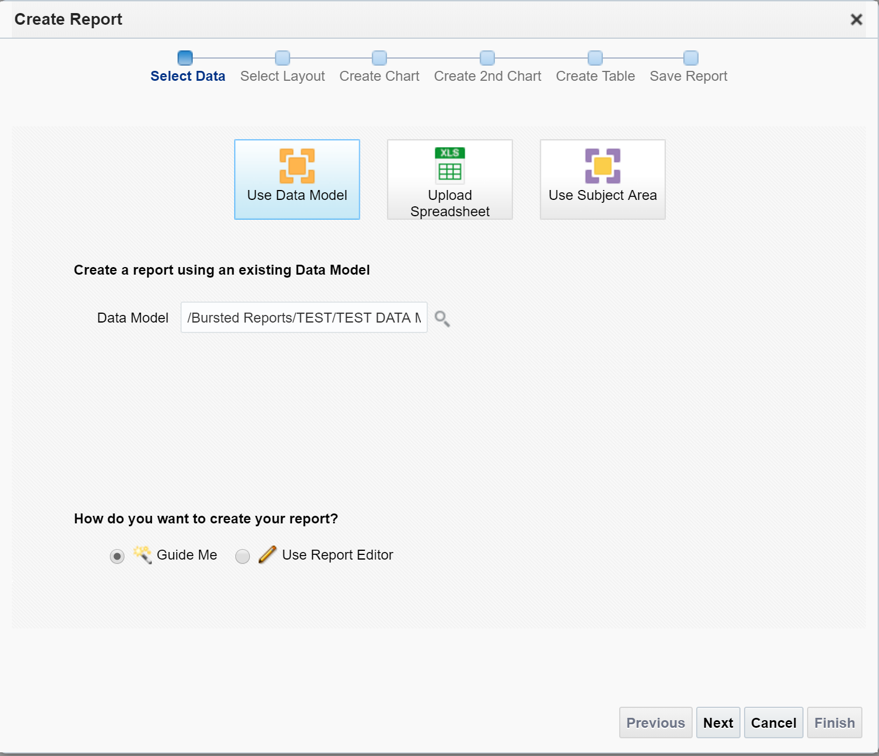
1. In the Create Report dialogue box, select data model as source and select the data model containing the data you want to use for the report. For an Excel template upload, select ‘Use Report Editor’ as the creation option.
2. Outside of BI Publisher, prepare your report template in Excel. This report template should be a visual template only without any data. You will have the ability to change this layout as you develop the report. Save the template on your computer for upload into BI Publisher.
3. Upload template into BI Publisher.
4. Name the report layout, select the Excel file to be used for the template, select ‘Excel’ as template type, and choose ‘English’ as the locale.
Tip: BI Publisher claims to accept .xlxs formats; however, I had the most success uploading .xls files.
5. Open a blank Excel document and ensure that the BI Publisher tab is visible.
6. Log into BI Publisher from the BI Publisher Excel tab.
7. Select ‘Open’ from the BI Publisher Tab.
8. Navigate to your report and click once. A list of templates should appear under layout templates. Highlight your Excel template, then select ‘Open Layout Template’.
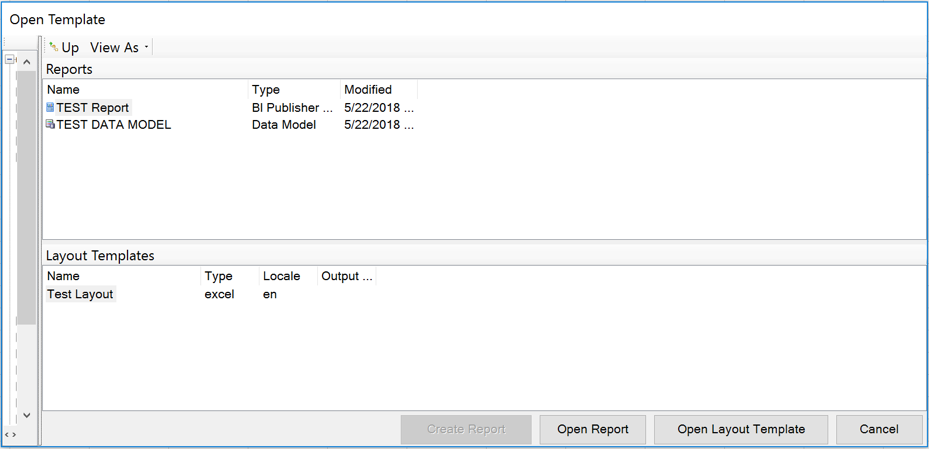
Another Excel workbook will open with your template. If you are successfully editing the BI Publisher template, the ‘Upload Template’ button should be enabled on the BI Publisher tab.
9. View a list of available data fields by selecting the Field button from the BI Publisher tab. You may get a notification saying that a metadata sheet will be created. Click OK.
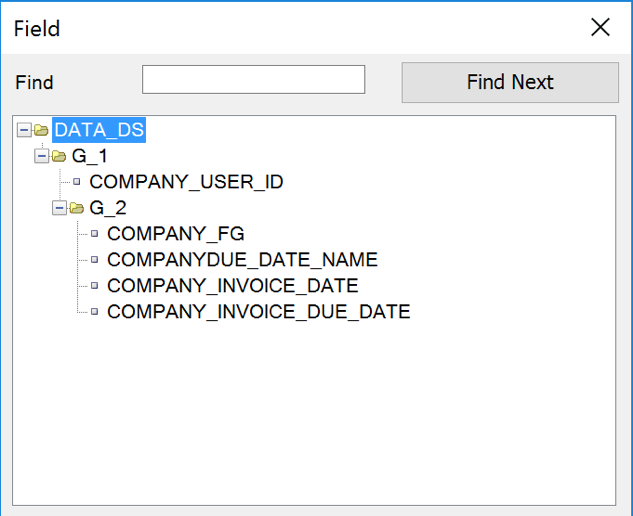
This is where intuitive naming in your data model pays off!
10. To add data fields to the Excel Spreadsheet, highlight the cell where you want the data, then double-click on the field in the data list.
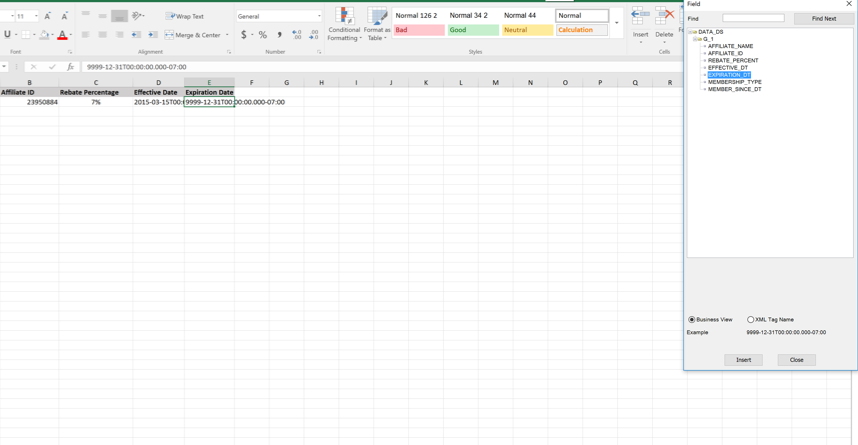
Adding a data field to your spreadsheet does two things that you will want to manage closely:
It adds a mapping on the XDO_METADATA tab. The XDO_METADATA tab was created when you first viewed the field list. You may have to unhide the tab to see it. The list of data constraints contains all the mappings in the workbook. The Excel cell name will be on the right and the field name will be on the left.
It adds a mapping to the Excel Name Manager.

Tip: If you delete a mapping in the workbook, neither the XDO_METADATA tab nor the Name Manager update automatically. You must manually manage this tab as you begin to remove field mappings from the spreadsheet. Incorrect mappings often cause the report to fail in build.
11. Save the Excel document. You can view a preview of the report by selecting the ‘Excel’ preview button on the BI Publisher tab. Keep in mind that you are planning to burst this report to only include one account, affiliate, etc. This will not be reflected in the preview. It will pull in all data from the sample data set.
12. To upload the edited version of the template to the BI Publisher service, select the ‘Upload Template’ button from the BI Publisher Template.
Once uploaded back to the Oracle Business Intelligence suite, the Excel template can be controlled and distributed like all other BI Publisher reports.
The more attractive features of using an Excel template in BI Publisher reports revolve around a user’s ability to control calculations and formatting at a granular level. The Excel add-in provides several tools that enhance these reporting controls. A few particularly useful tools are discussed below.
Excel Template Tools
1. Repeating groups: Often in Excel templates, you will want a unique row for each record in the data set. This is accomplished using a repeating group. In the example below, I am looking for a list of affiliates with their respective rebate percentage.
I have already created my Excel template and mapped my data model fields to the appropriate Excel cells as shown below:
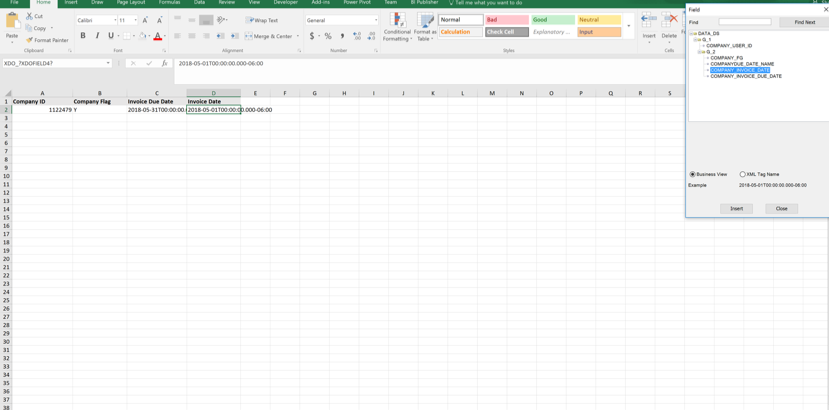
If I preview my report at this point, I only get one line of data which is presumably the first record of the BI Publisher data set.

To create a repeating group, highlight the Excel cells that you want repeated and select ‘Repeating Group’ from the BI Publisher tab.
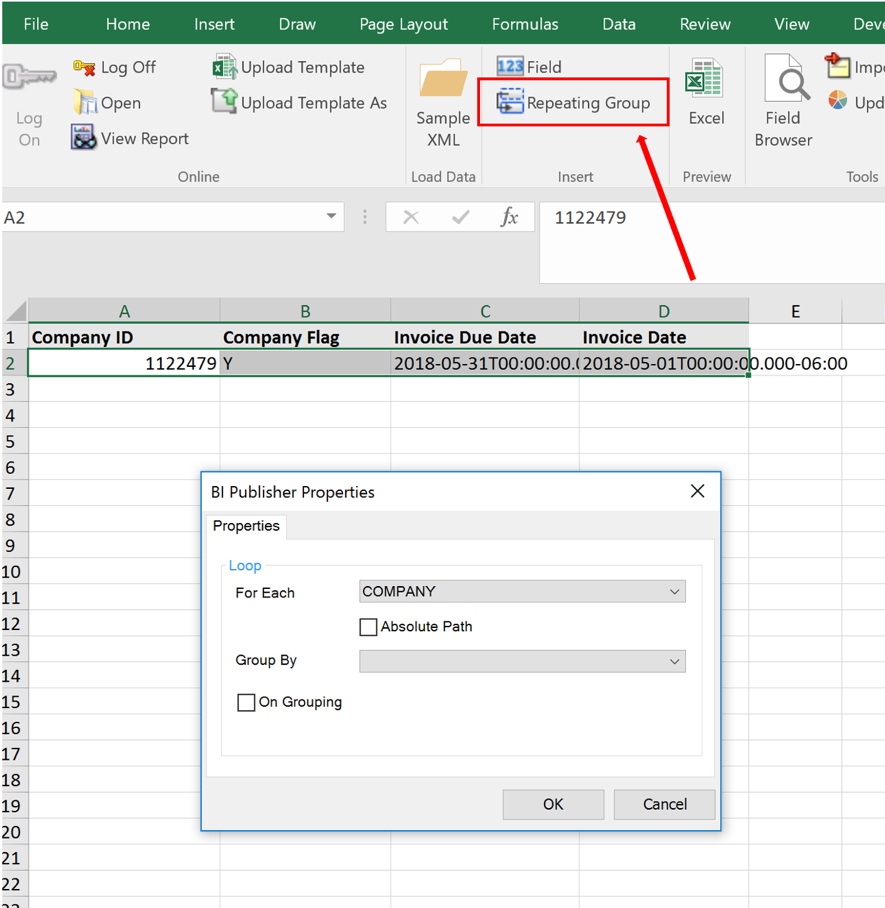
There are many advanced options that can be achieved through the ‘For Each’ and ‘Group By’ selections. In this case, my data set contains one row for every row I want in the Excel list, and all the data I want repeated is from the same BI Publisher data set (see notes on building a data model for an Excel template). I will select the data set name as the ‘For Each’ and leave the ‘Group By’ blank. If your data set is more complex, the grouping options will be different.
The new preview now shows all the data from my data model:

If you need to make changes to a repeating group, you will need to delete the repeating group (from the XDO_METADATA sheet and the Excel Name Manager) and recreate the group.
2. Date formats: The BI Publisher default date format is in canonical format of YYYY-MM-DDThh:mm:ss+HH:MM. While there are options for changing the date format in the data model, I found it easiest to manage this in Excel.
Once you have your date field mapped to your Excel workbook, insert a new column and use the following Excel formula to convert the date:
=DATEVALUE(LEFT(‘CANONICAL DATE’,10))
You can then use the standard Excel data types to format the date to the format you prefer.
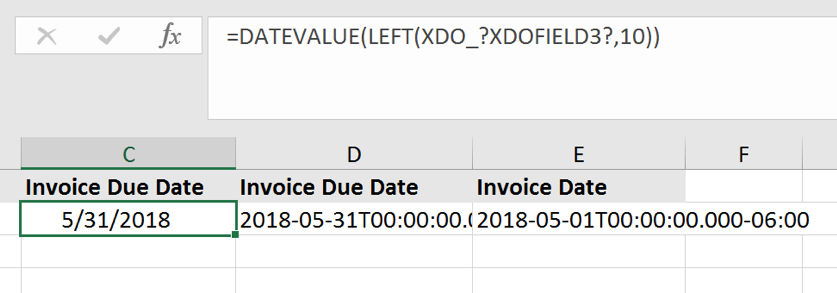
Hide the original date column from view, and you are good to go.

Overview
With the focus on analytics and data-driven decisions in today’s business world, there are a large variety of reporting options available ranging from extremely basic to fully robust capabilities. The Excel template BI Publisher report can be a great step toward streamlining and automating the manual Excel reports of old.
If your company is struggling with ununified, time-consuming, and manual reporting, feel free to reach out to me at adearman@credera.com or contact us online. We would love to help you tackle your reporting and analytics roadmap.
Contact Us
Let's talk!
We're ready to help turn your biggest challenges into your biggest advantages.
Searching for a new career?
View job openings