Data
Aug 30, 2023
4 best practices in designing data architecture for your carbon data strategy

Forward-looking businesses are entering a new era of carbon emissions accounting, with over half of the largest companies setting emissions goals. The rising demands for transparency, evolving regulations, and impending disclosure requirements are driving companies to develop strategies for systematic, auditable emissions accounting.
As mentioned in our first article in our carbon accounting series, the best prepared companies are establishing carbon data strategies, which focuses on collecting and preparing data for carbon emissions reporting and decision-making. It involves evaluating existing data, designing technology architecture, and setting up organizational processes to support long-term carbon management. Credera recently helped Omnicom, one of the world’s largest advertising and marketing services conglomerates, develop a carbon data strategy and management platform.
This article will focus on the technical side from taking a data inventory to designing data architecture. Not only is this process essential for rigorous carbon accounting, but it can jump start the creation of an organizational data strategy by identifying the key areas for maturity. This is because carbon emissions reporting involves transforming several disparate data sources across an organization from real estate to travel records as seen in the figure below.
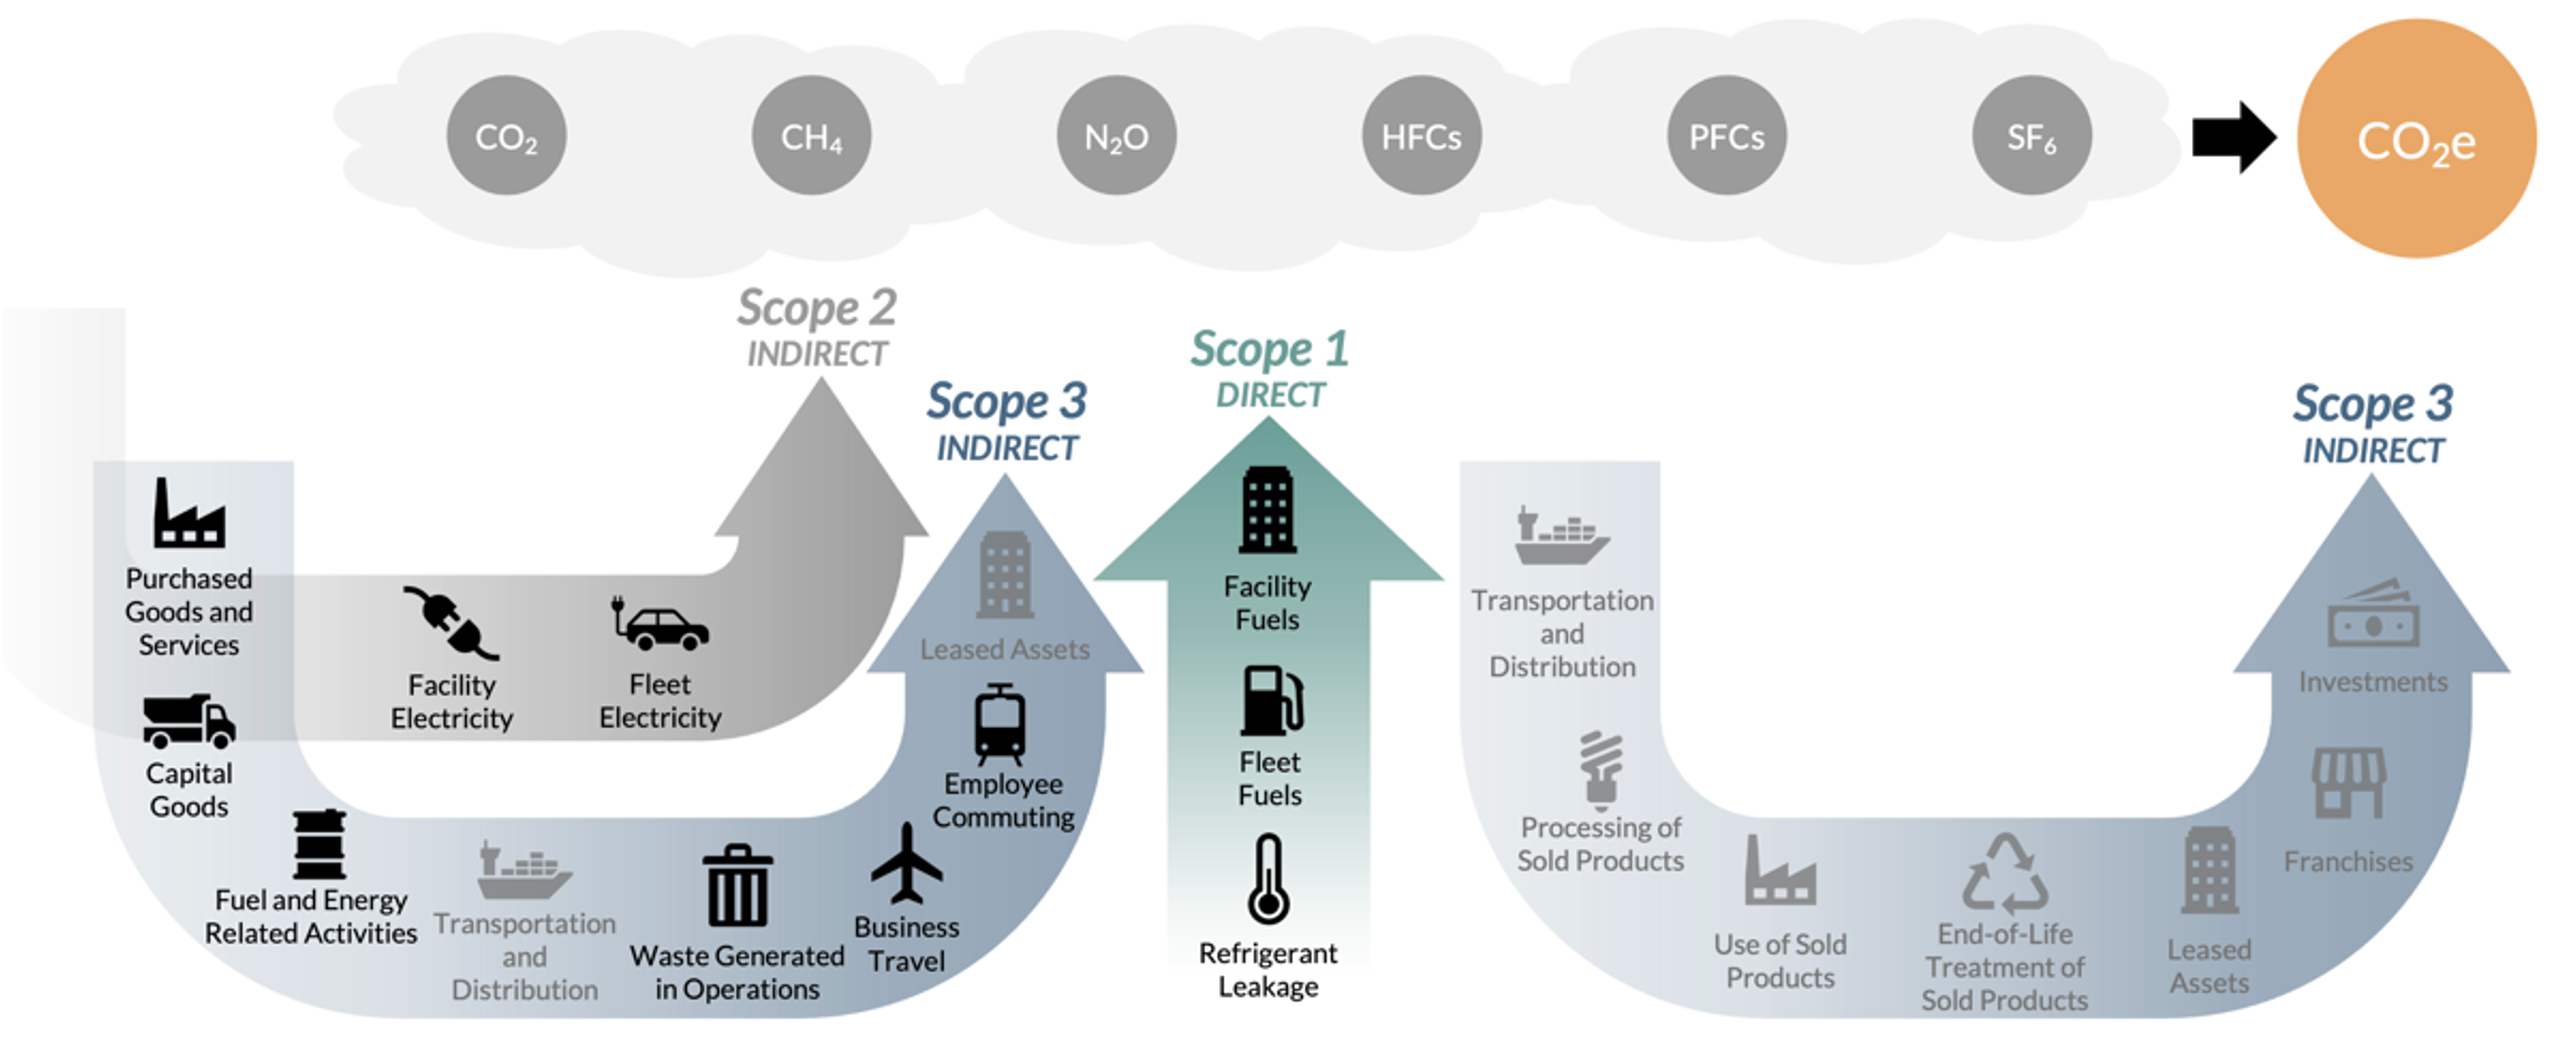
Figure 1: Greenhouse Gas Protocol scopes and corresponding activity categories.
Step 1: Getting started with a carbon data strategy
A carbon data strategy centers around making the most of the data an organization can source. The first step to a carbon data strategy involves understanding the data landscape.
Take inventory of existing data
Start by examining the list of greenhouse gas (GHG) categories and identifying the inputs required for reporting in each category as seen in Figure 2 below. This must be done in accordance with the Greenhouse Gas (GHG) Protocol, a comprehensive international standard for measuring and managing emissions. After determining the necessary data sources, collaborate with organizational owners to pinpoint the right systems for data collection, while considering the availability, rigor, and completeness of the data.
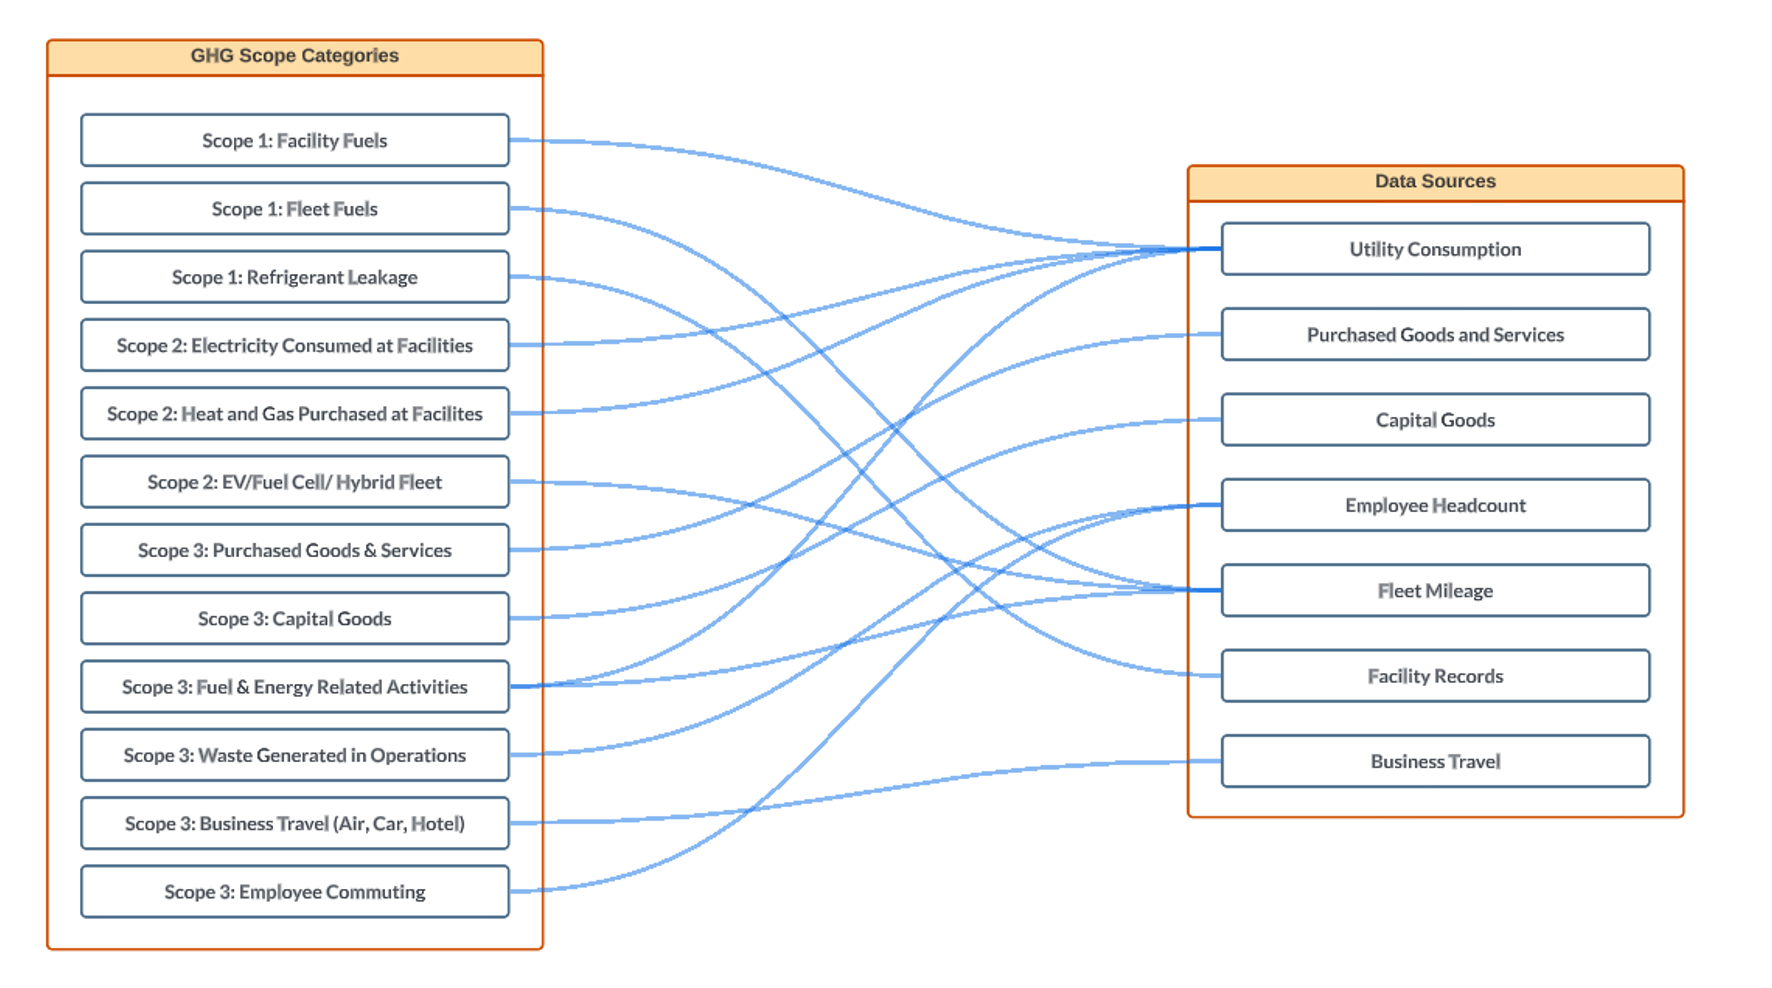
Figure 2: Sample mapping of activity data sources to GHG scopes.
To streamline the reporting process, work with data owners to create a standardized report format that can be processed on a recurring basis. This approach ensures consistency and efficiency in data collection, lessening the legwork required each reporting cycle.
Step 2: Designing data architecture
Once data is collected, the next step is to build data architecture to support carbon calculations. This involves developing pipelines to ingest and transform activity data to meet reporting needs. Sustainability cloud solutions is an emergent space in which many players like AWS and Microsoft have developed solutions and guidelines. Credera’s partnership and experience with both cloud providers allows us to tailor the carbon data architecture to what best integrates with an organization’s existing offerings, whether it be one of these or a third-party offering. Regardless of which provider’s technology undergirds the architecture, several best practices in data modelling and architecture should be kept in mind:
Centralize data
Because carbon accounting relies on disparate data sources, organizations often struggle to combine this data into a centralized model that meets reporting standards, preventing meaningful dissection of the data into actionable information.
For instance, the representation of entities (e.g., countries, business units, etc.) might vary, with some databases storing them as abbreviations and others as full names. This discrepancy makes it challenging to group emissions results by these entities.
To appropriately centralize source data, organizations should determine the most meaningful dimensions to report along, identify a source of truth for these, and map each data source to it (e.g., a single or series of metadata tables). These dimensions most commonly relate to geographic location, business unit, function, and/or vendor of the activity. Reconciling disparate sources allows for reporting that unlocks valuable insights scattered across an organization.
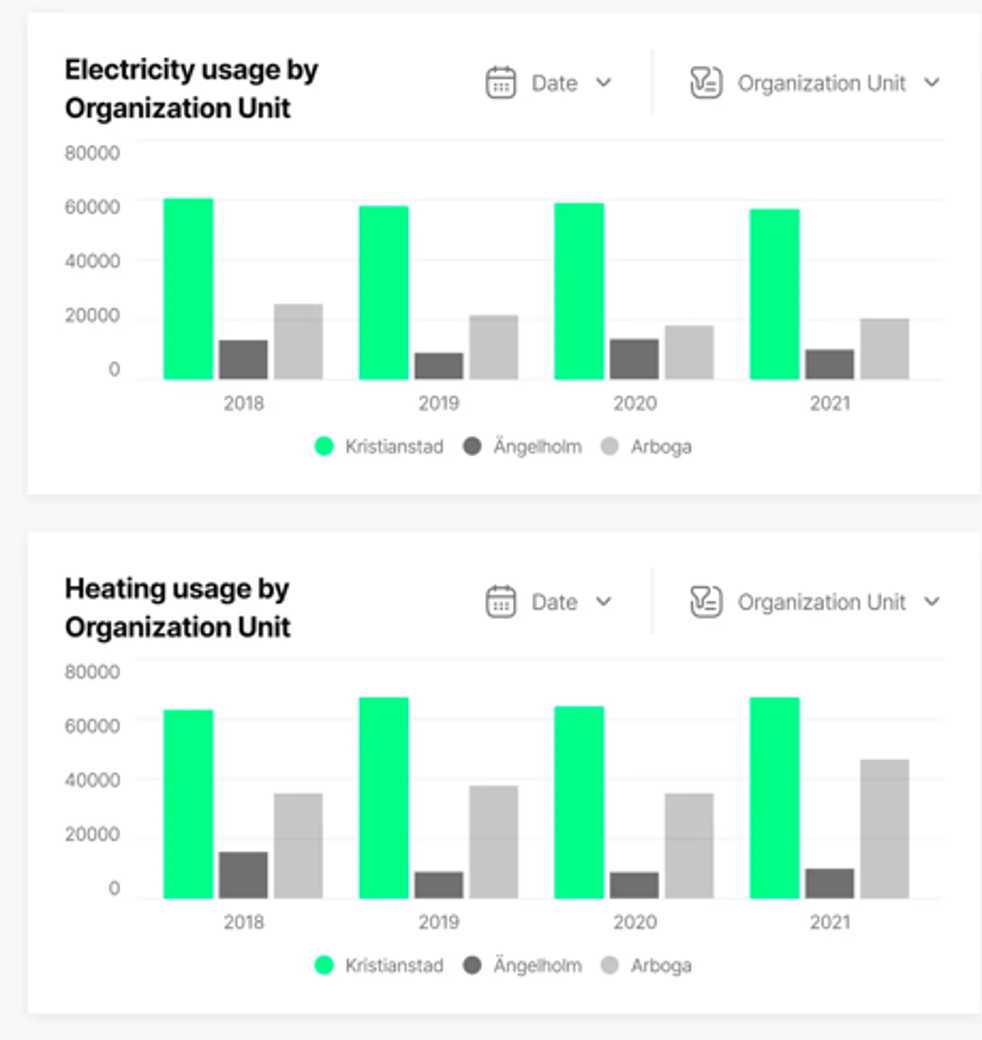
Figure 3: Sample visual with reports by organizational units as displayed in Apiko carbon accounting tool.
In addition to field alignment, another facet of data centralization is consolidation. For example, facility square footage and utility usage are standard inputs for calculating carbon footprints. If these records originate from distinct sources, ensuring a common identifier between them greatly enhances reporting. Any gaps in utility data can be rectified using square footage estimates. Additionally, the reconciled data can be analyzed along dimensions from real estate metadata, such as business units, geographical location, or building type, which provide key information on where reduction efforts should be targeted.
Reconciling disparate data sources not only resolves the immediate issue of mismatched standards, but it also facilitates a unified view of the organization's data, which enables more comprehensive analysis and targeted decision-making. This does not have to be an all-encompassing effort, but finding areas to standardize dimension definitions, introduce common identifiers, and/or set up data mapping schemas between identifiers across the organization can kickstart a more centralized data strategy.
Enrich data
Because activity data powering a carbon data strategy is sourced from across an organization, there are opportunities to enrich data across these sources. Often, using an enrichment process would allow an organization to report a lower, more precise footprint than one obtained via standard conservative emissions factors based on estimates.
Take, for instance, calculating employee commuting emissions. While it is impractical for any organization to maintain a log of commuting patterns for each employee, informing calculation assumptions about commuting behaviors allows for a less conservative approach in estimating emissions per employee. Commuting patterns can significantly differ between cities, so a country-level headcount report would have to make broad assumptions about employee commuting patterns. A practical implementation of this concept would be to allocate headcount at the city level so emission factors can be more precise to commuting patterns.
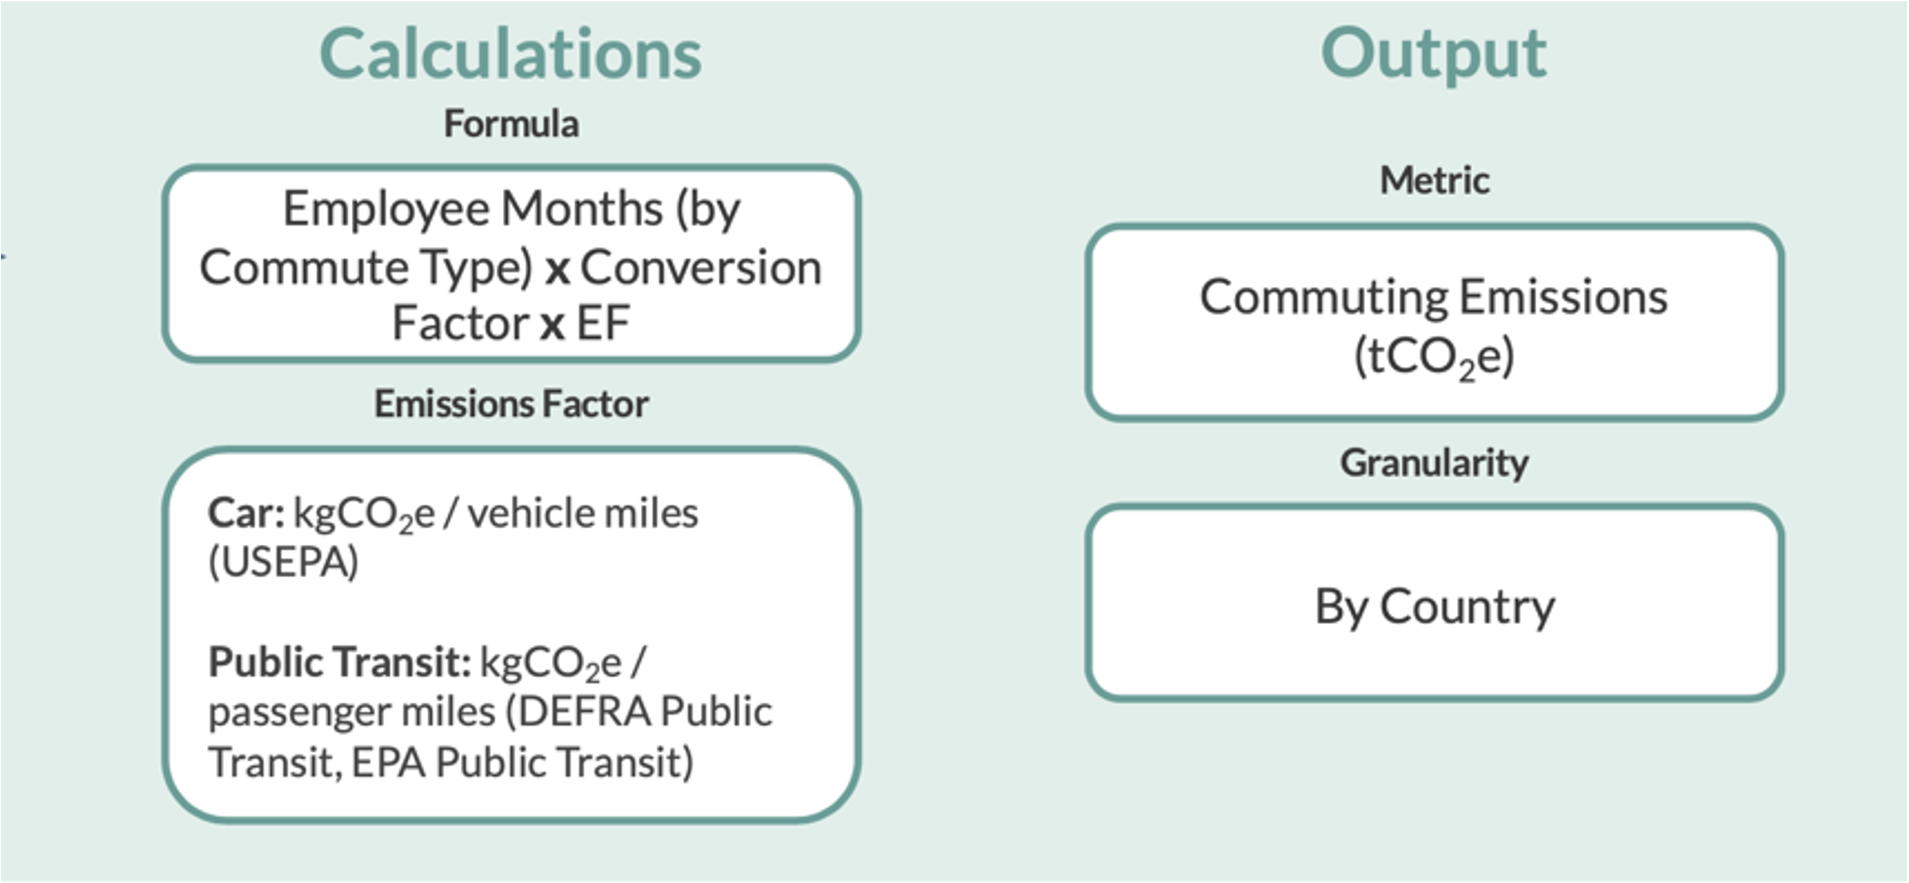
Figure 4: Detail on commuting emissions calculation sample methodology.
In situations where city-level data is not available, organizations can estimate headcount allocation. For instance, real estate data could reveal an organization's geographical footprint and headcount could be allocated proportionally by square footage. Finding ways to enrich data can enhance the precision of carbon footprint calculations, so organizations should work with experts upfront to identify targets for adding granularity to available data.
By making carbon emissions calculations more detailed, organization are also making their footprint reports more actionable. If the only datapoint in calculating emissions is headcount, the only way to reduce emissions would be to decrease headcount. However, more datapoints means more opportunities to act.
Validate data
Ensuring the data quality of activity data is crucial to generating auditable footprint reports. Within an organization’s data architecture, from data ingestion to the reporting layer, each stage must be subjected to rigorous validation. Given that data is sourced from various business areas, business owners should be involved in the validation process, which fosters a sense of ownership among stakeholders. They are best equipped to confirm whether the final output aligns with their expectations. One effective approach to facilitate this process is through visualization as shown in Figure 5 below.
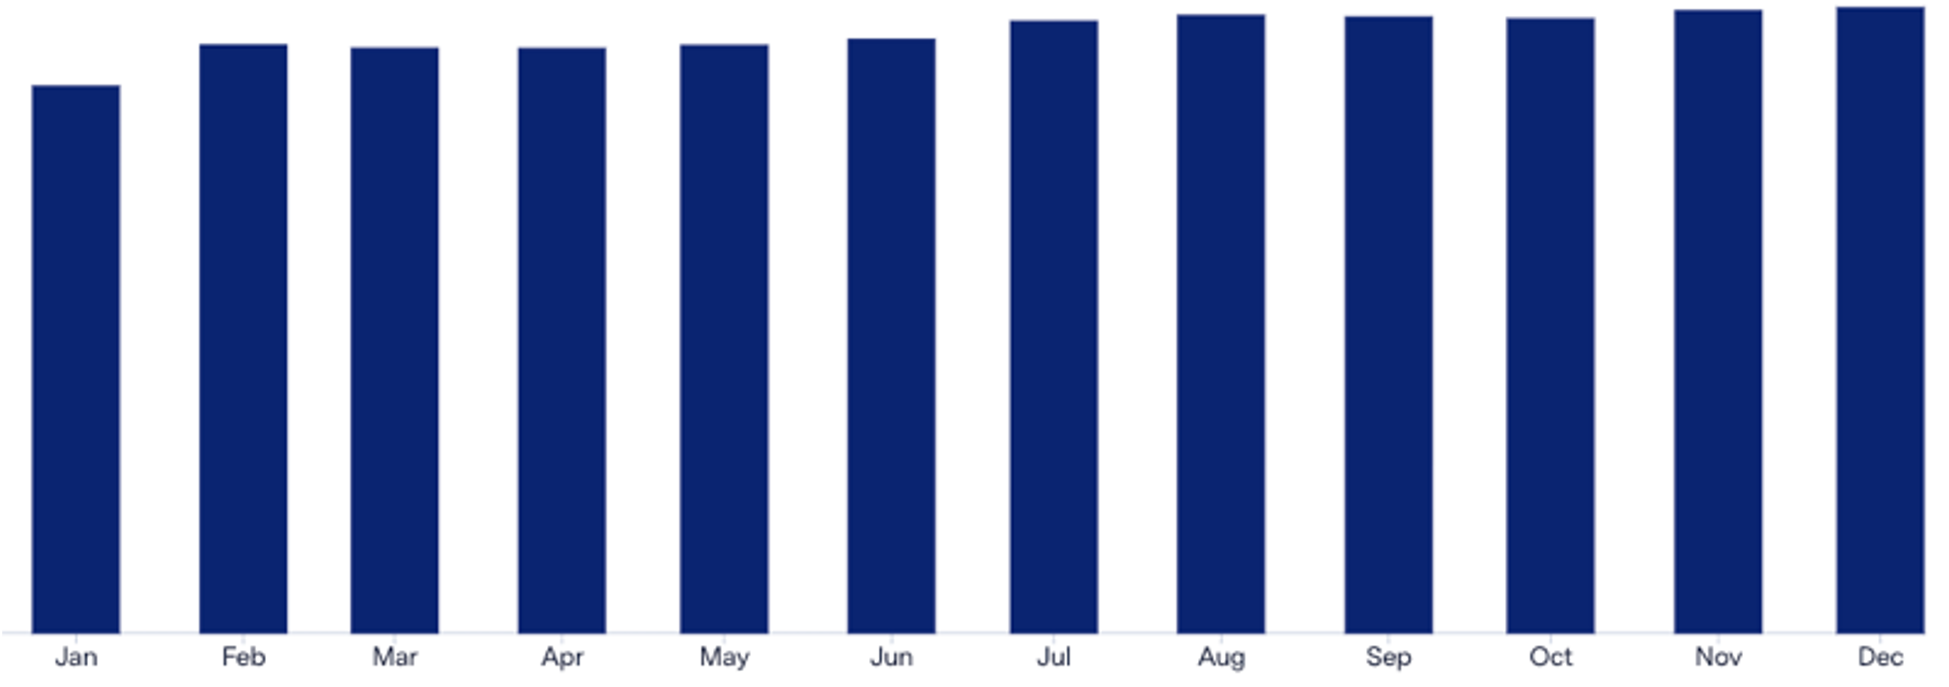
Figure 5: Month over month trendline sample trend analysis.
Beyond checks with data source owners, an organization must develop a suite of data quality solutions that will alert to any anomalies that may occur during data processing. This would involve ensuring activity data sums are not affected by the transformation process, metadata values are not altered, and no records are duplicated or dropped, among a variety of other tests. These then could be monitored via data quality dashboard or another alerting system. The specific set of tests and tools should be tailored to the organization to ensure team members are able to respond to data quality issues in a timely manner.
Repeatability of loads
In carbon emissions reporting, each type of activity data necessitates a distinct transformation pipeline. The demands of dataset specific processes must be balanced with maintaining a repeatable and easily interpretable process across each reporting cycle. The creation of a template pipeline can serve as an excellent foundation. This template would capture patterns for data ingestion, staging, transformations, loading, and data quality checks. From there, each pipeline requires tailoring to meet the unique requirements of each dataset.
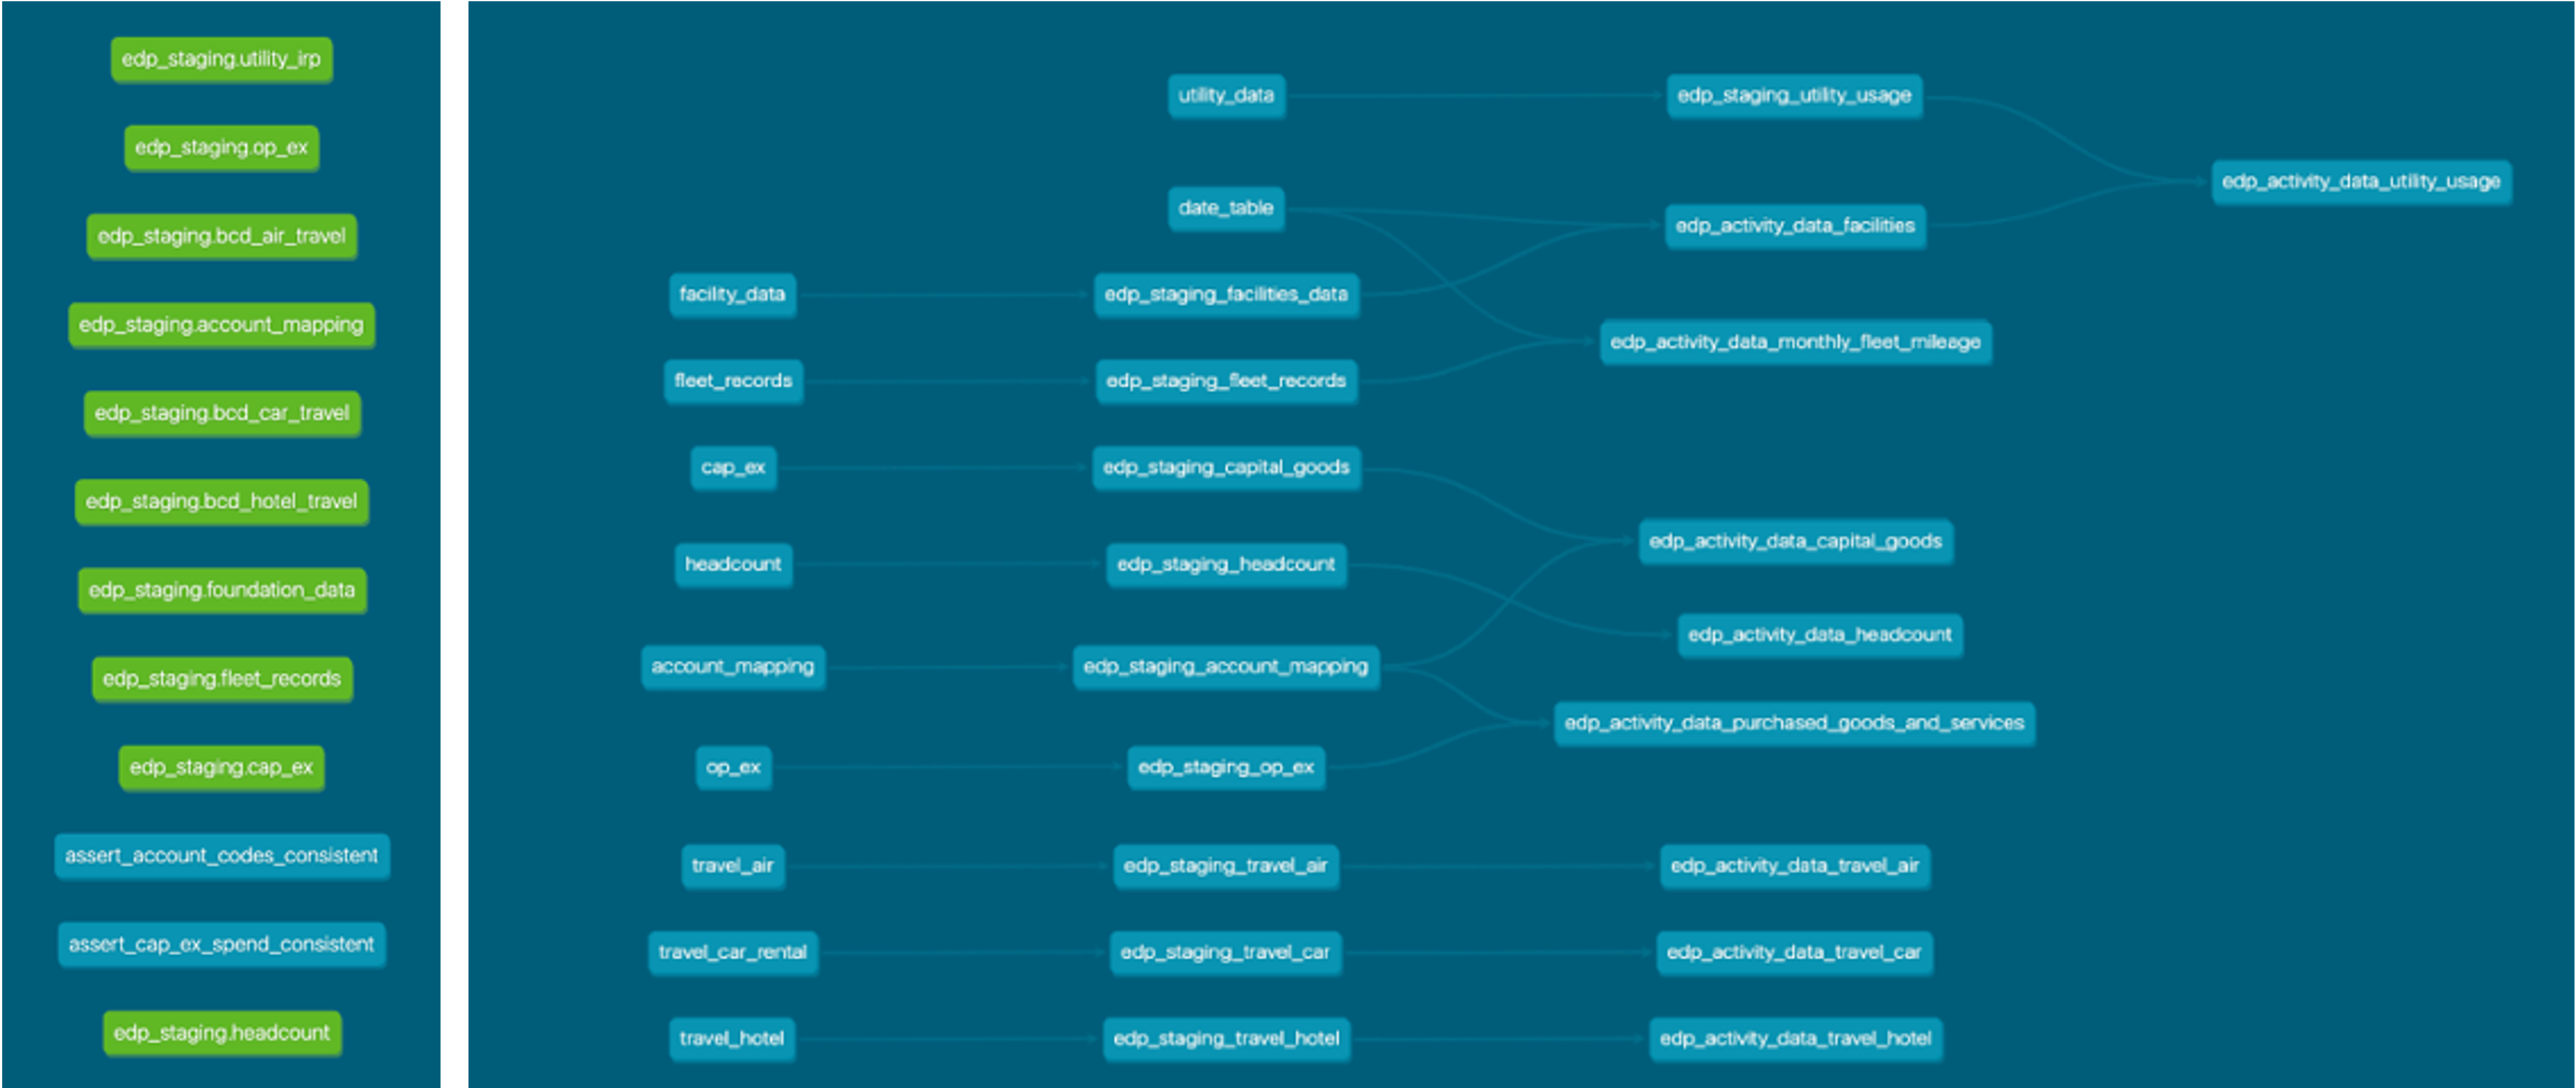
Figure 6: dbt lineage diagram including sample data seeds and carbon activity data processing data model accelerator.
At Credera, we have harnessed our expertise to develop an accelerator that templatizes pipelines for each of the key activity data areas specified by the GHG Protocol. This tool can help expedite the establishment of your carbon data strategy. From there, we help clients to refine this solution, ensuring it meets the specific needs of the organization.
Taking action on a carbon data strategy
The development of a carbon data strategy helps businesses ensure the robustness and accuracy of their carbon emissions reporting by creating an organizational data strategy that leverages their disparate data sources. Throughout this process, it is essential to design robust data architecture, centralize and reconcile disparate data sources, enrich activity data, validate data quality, and ensure the repeatability of data loads. From there, the next step is developing organizational processes to carry out the carbon data strategy long term.
A carbon data strategy is not just a necessity for rigorous carbon accounting reporting—it is an opportunity to mature your organization's overall data architecture and governance. If you are ready to meet the demands of this new era of emissions accounting, we invite you to reach out to Credera. If you want to continue the conversation on how we can help build a carbon data strategy tailored to your organization's unique needs, reach out at marketing@credera.com.
Contact Us
Ready to achieve your vision? We're here to help.
We'd love to start a conversation. Fill out the form and we'll connect you with the right person.
Searching for a new career?
View job openings


