


This is the fourth in a multi-part series on Tableau. In case you missed it, here is part three.
Default values for filters are a well-documented issue in Tableau, especially for dates (see the top idea in the Tableau support community). Relief is in sight as Tableau is finally addressing the issue, but as of Tableau 9.0.3, there isn’t a great solution. Relative date filters can provide some assistance, but they can still fall short in year-over-year (YOY) views. For example, we can’t view this year-to-date versus last year for the same period just by using a simple relative filter. If we did view all of 2014 versus all of 2015 before the end of the year, we would be displaying incomplete data. Luckily, we’ve figured out a couple tricks that will let us get more out of these relative filters and still get that YOY view without manually clicking every day.
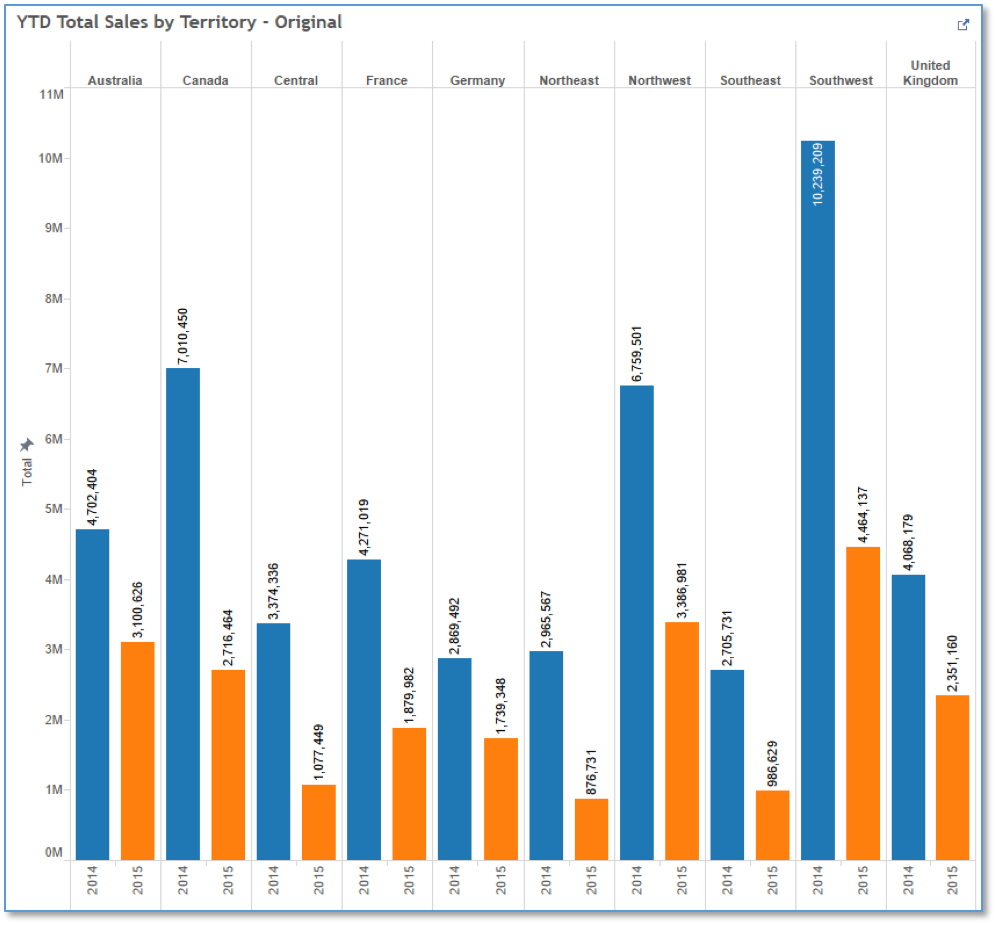
Using data in the SalesOrderHeader table from AdventureWorks, we created a data connection to pull in data from 2014 and 2015 and group it by year and territory. Below is the output. You can see that 2014 performed better than 2015, but a quick look at the source data reveals that we only have data up to September 2015. We can change the SQL to only show relevant data to get a true picture of how this year is performing against last year.
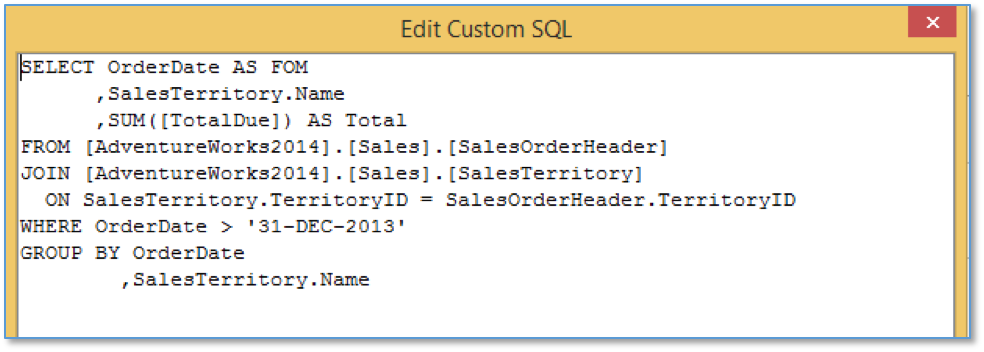
Step 1 – Edit Custom SQL Data Connection
In this step we will edit the custom SQL from the original SQL above.
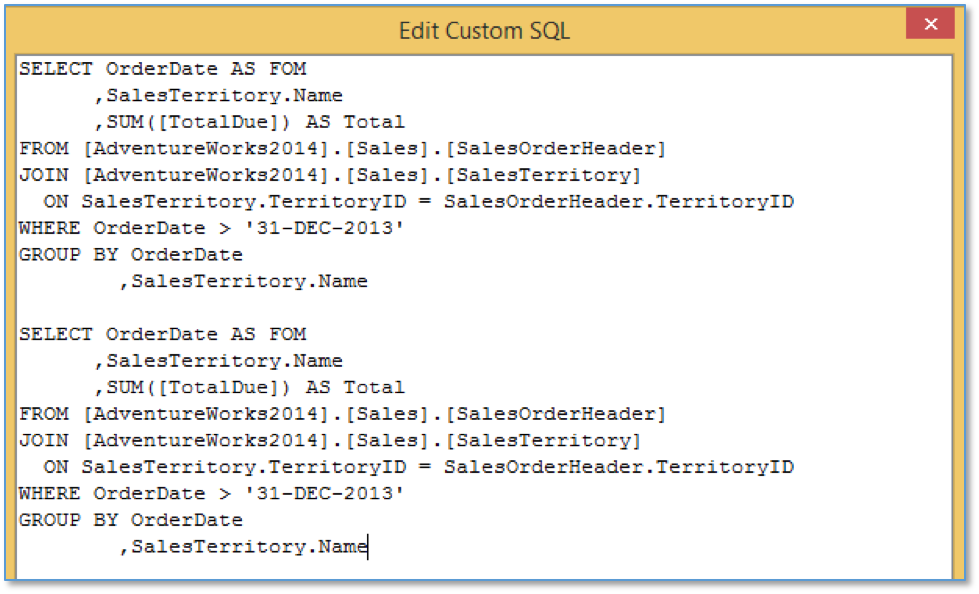
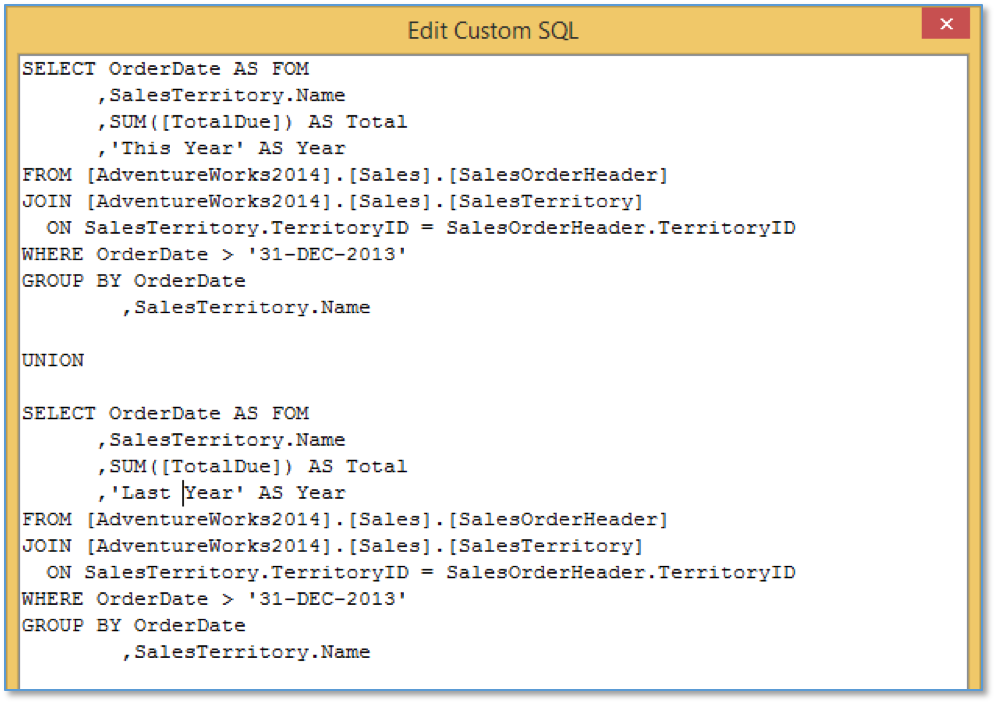
To edit the custom SQL, you’ll need to open the data connection, copy the original SQL, and paste a copy.
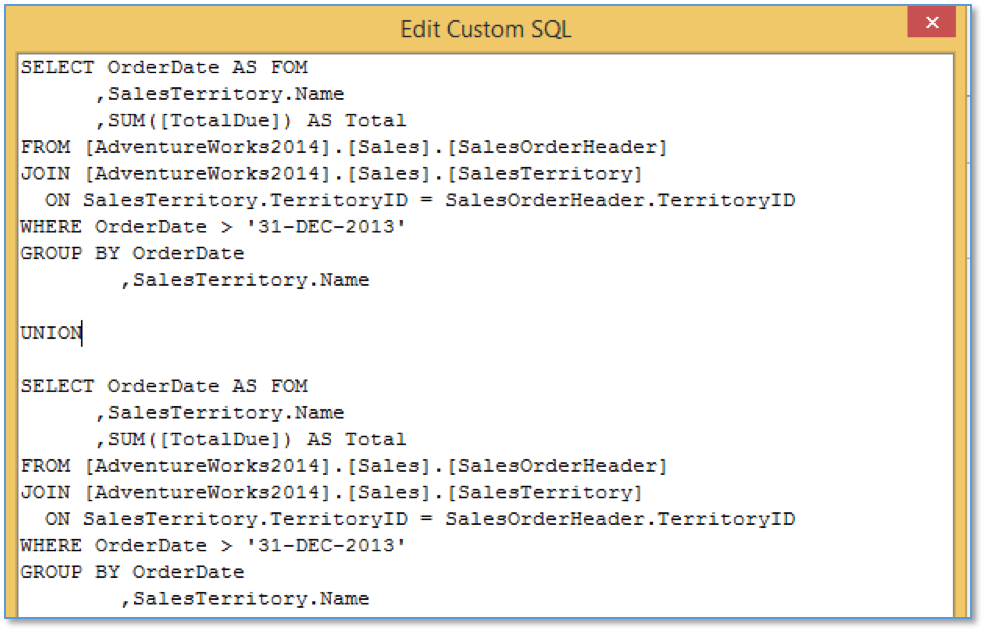
Add a UNION clause between the queries.
Add a new column with the value of ‘This Year’ to the original SQL. This new column will be our new x-axis on the report. On the second portion add the same new column with the value ‘Last Year’.
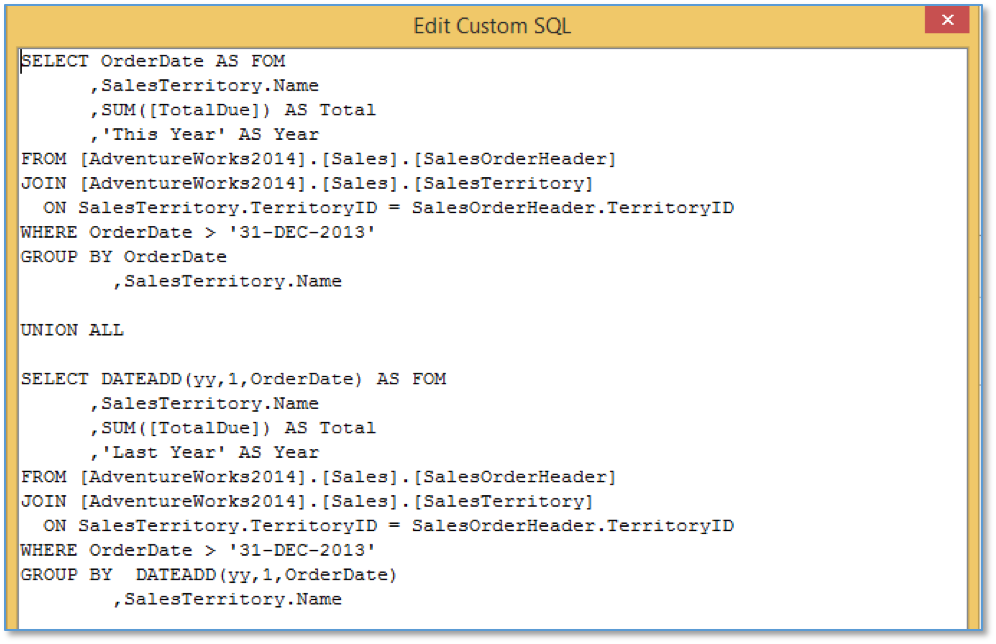
Finally, we need to add one year to the date in only the ‘Last Year’ portion. This isn’t necessarily intuitive, but adding a year to 2014 will mean all data from 2014 shows up as a date in 2015. When we update the report in the next few steps, this will be important for our relative date filter to work as expected.
Step 2 – Update the Report
We need to modify the original sheet slightly to show the data relevant for year to date.
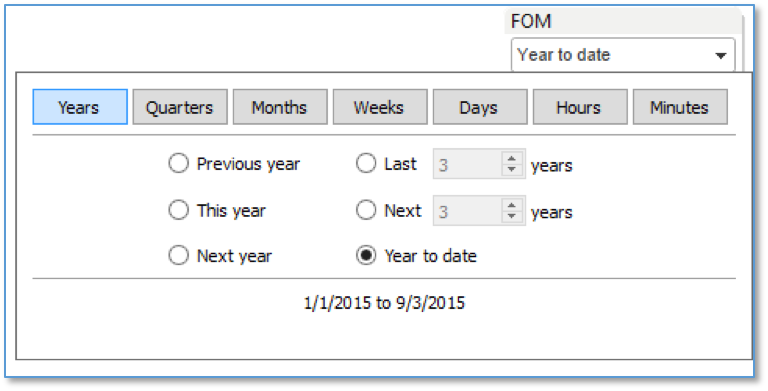
Add a relative date filter for YTD on your date column.
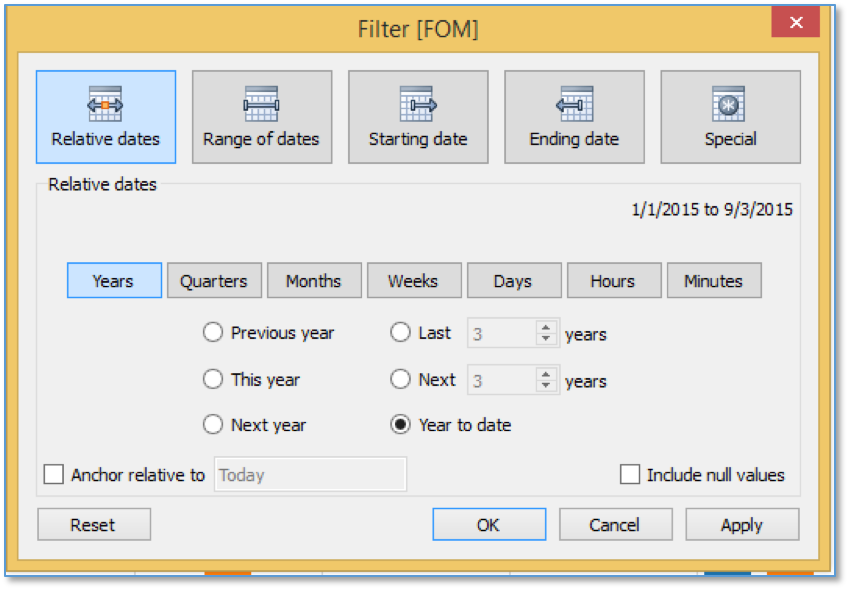
You can see we are selecting only data up through 9/3/2015. In the previous step, we added a year to the date in the ‘Last Year’ SQL to appear as data in 2015. With this new relative date filter we will see both data from 2014 and 2015.
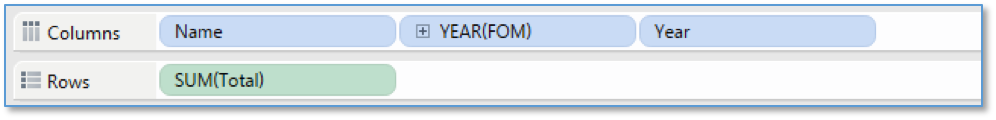
Drag your new column (in this case ‘Year’) to the columns card. By changing the axis to our new column we can group the data by the correct year.
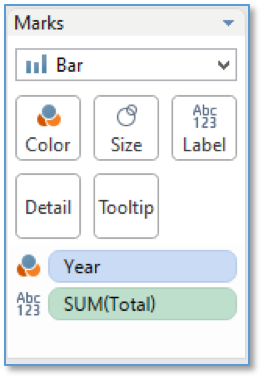
Finally, change the dimension associated with color to our new column ‘Year’.
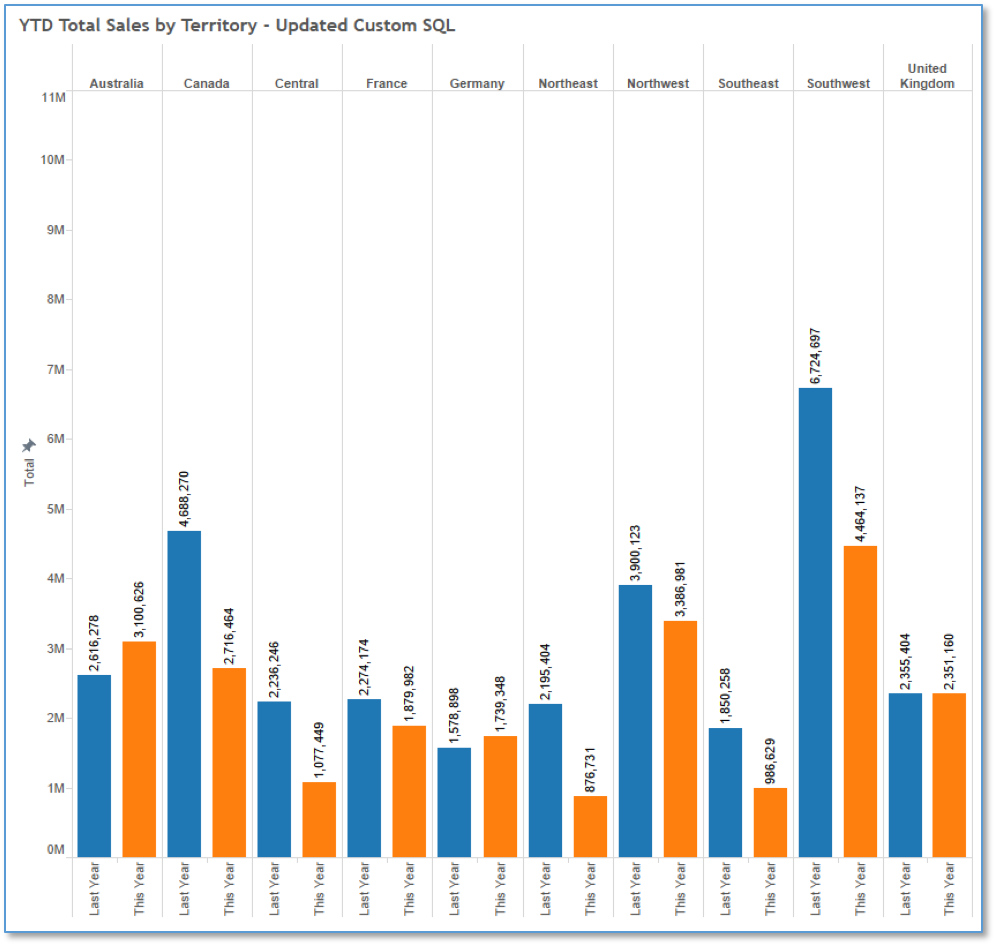
Changes are complete. You can see the values have updated to only show data from last year up to the max day of this year. In this case, that’s data through Sept. 3.
Final Comparison
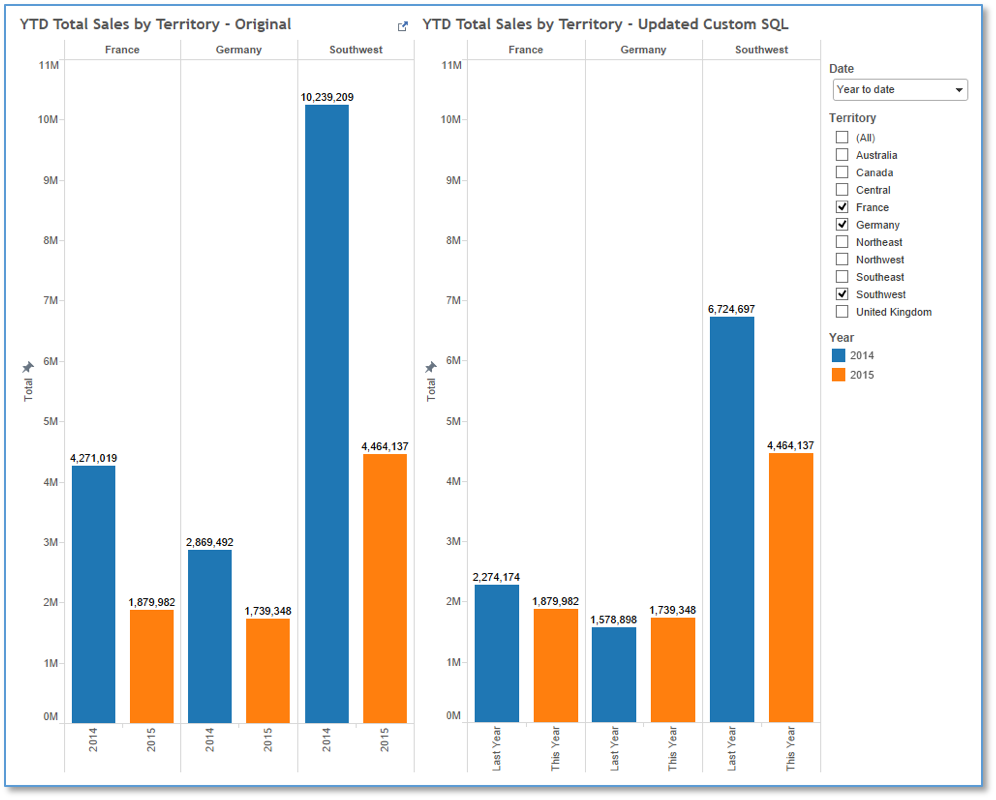
Below we’ve laid out the original chart next to the final chart with all of our changes. We hid a few labels and fixed the y-axis for this example so you can visually compare the two charts.
If you have questions about this blog post, please leave a comment below, tweet us @CrederaIT, or contact us online. Remember to stay tuned for the next installment in our blog series, Tableau Workaround Part 5: Default Map Coloring in Tableau.
Contact Us
Ready to achieve your vision? We're here to help.
We'd love to start a conversation. Fill out the form and we'll connect you with the right person.
Searching for a new career?
View job openings